The average Ironman time is only useful when you know what it hides: course difficulty, pacing discipline, nutrition, and how efficiently you move through the swim, bike, and marathon. A full IRONMAN is 140.6 miles, and the difference between a clean race and a messy one can easily be an hour or more. In this article, I break down the typical finish window, the splits behind it, and the practical levers that matter most if you want a realistic target.
Key facts at a glance
- Most published finisher analyses place the typical full-Ironman result around 12 hours 35 minutes to 12 hours 50 minutes.
- The official race cutoff is 17 hours, so the field stretches from elite times to very long finishes.
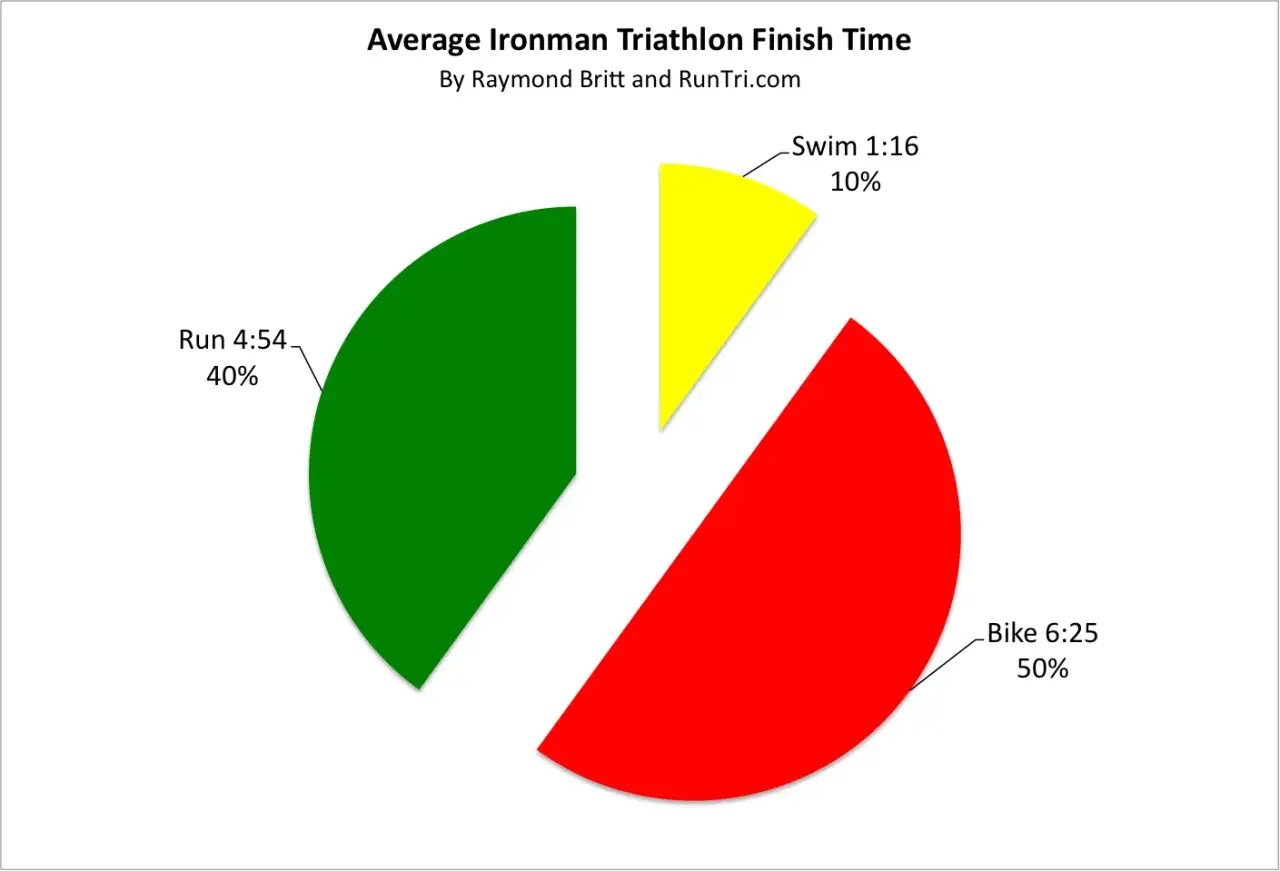
- Average splits usually cluster around a 1:16-1:19 swim, a 6:19-6:25 bike, and a 4:50-4:55 run.
- A strong age-grouper often finishes in the 10 to 11.5 hour range; many first-timers land closer to 13.5 to 15.5 hours.
- The bike leg usually decides the day more than the swim, because it consumes about half of the total race time.
What the typical finish looks like in real life
When I look at Ironman results, I do not treat one average as a prediction. I treat it as a rough benchmark. In most finisher datasets, the middle of the field sits somewhere around 12 hours and 35-50 minutes, but that number hides a lot of variation. A flat course on a cool day can feel very different from a windy, hilly, or hot race with the same field strength.
For most athletes in the United States, a more useful way to think about the race is by finish band rather than a single number. That gives you a target that respects your current swim strength, bike durability, and run resilience instead of forcing one generic answer onto every athlete.
| Athlete profile | Typical full-Ironman finish window | What it usually means |
|---|---|---|
| Elite/pro | 8:00-9:30 | Race-specific speed, efficient transitions, and very high power or run pace |
| Strong age-grouper | 9:30-11:30 | Solid swim control, disciplined bike pacing, and a marathon that does not fall apart |
| Middle-pack finisher | 11:30-13:30 | The most common place to land for well-trained recreational athletes |
| First-time finisher or cautious racer | 13:30-15:30 | Conservative pacing, extra time in transitions, or slower run splits late in the day |
The big takeaway is simple: the average tells you where the field sits, but your own target should come from the way you race each discipline. That becomes clearer once you look at the splits behind the final time.

Why the bike leg decides most finish times
The swim gets attention because it is the first part of the race, but the bike is where most athletes either stabilize their day or quietly ruin it. Published finisher analyses usually show the swim taking about 1 hour 16 minutes to 1 hour 19 minutes, the bike about 6 hours 19 minutes to 6 hours 25 minutes, and the run about 4 hours 50 minutes to 4 hours 55 minutes. Transitions are small in comparison, but they still add up.
| Segment | Typical average time | Why it matters |
|---|---|---|
| Swim | 1:16-1:19 | Sets the tone, but usually changes the final result less than the bike or run |
| Bike | 6:19-6:25 | Consumes about half of the day and has the biggest effect on run quality |
| Run | 4:50-4:55 | Where fatigue, heat, and nutrition mistakes become visible |
| Transitions | 10-20 minutes total | Easy minutes to lose if gear handling and routine are sloppy |
That is why I tell athletes not to chase a heroic swim at the expense of the bike. A controlled first 2,000 meters, clean sighting, and calm breathing often protect the rest of the race better than a frantic start ever could. If the swim leaves you breathing hard and overexcited, the bike starts in the red, and the marathon usually collects the debt later.
How age, experience, and course profile change the number
Not all Ironman finishes are comparable. Age, race experience, sex, and the course itself all shape the clock. In broad terms, men tend to post slightly faster average times than women, younger age groups usually finish faster than older ones, and experienced athletes usually look more efficient than first-timers even when their raw fitness is similar.
Course profile matters more than many newcomers expect. A flatter, cooler venue can make the same athlete look dramatically faster than a hilly, windy, or hot race. I have seen athletes post nearly identical fitness numbers and still swing by 30 to 60 minutes just because the venue rewarded steady pacing and punished bad gearing or poor heat management.
- Age: most athletes peak somewhere in the 25-39 range, then finish times tend to drift upward gradually.
- Experience: first-timers often lose time in transitions, pacing, and nutrition, not just fitness.
- Course: rough roads, headwinds, climbs, and heat can turn a manageable race into a long survival test.
- Swim background: stronger open-water swimmers often save energy early, which can pay off later even if the raw time difference is not huge.
If you want a fair comparison, compare like with like: similar course, similar conditions, similar level of experience. Once you do that, the next question becomes what counts as a good time for your own level.
What usually makes athletes faster or slower than the average
The biggest mistakes are rarely mysterious. They are usually the same few things repeated at scale: a swim start that is too aggressive, a bike effort that creeps above target, a nutrition plan that looks good on paper but fails after hour six, and a marathon that begins at the wrong pace. Even small errors can snowball because Ironman is long enough to punish them repeatedly.
Here is the pattern I see most often: athletes gain a few minutes early and give back far more later. That is why a smart race plan is mostly about limiting damage.
| Common mistake | Typical result |
|---|---|
| Starting the swim too hard | Higher heart rate, shaky breathing, and slower bike power later |
| Overbiking in the first half | A marathon that unravels, often with walk breaks or pace fade |
| Underfueling on the bike | Late-race energy crash that is hard to recover from |
| Sloppy transitions | Usually 3-8 minutes lost across the day with no real performance gain |
| Poor open-water skills | Extra stress, wasted energy, and a less controlled start |
For U.S. age-group athletes, the cheapest time gains often come from swim efficiency, cleaner transitions, and better bike pacing rather than from one more hard workout. That is especially true for athletes coming from a swimming background who already have decent water comfort but need better race-day rhythm on the bike and run.
How I would train if my goal were to beat the average
If I were building a plan from scratch, I would not try to “win” the swim and then survive the rest. I would try to finish the swim calm, ride with discipline, and run with enough control to keep moving late. That approach is less dramatic, but it works.
- Swim with purpose, not panic. One technique-focused session and one open-water or race-effort session each week can do more than mindless volume.
- Practice sighting and starts. Efficient sighting every few strokes, staying relaxed in the pack, and using legal drafting when appropriate save energy that matters later.
- Train the bike as the main event. Long rides should include race-effort blocks and fueling practice, because the bike shapes the marathon more than most athletes admit.
- Use nutrition as a skill. Many athletes tolerate roughly 60-90 grams of carbs per hour on the bike when they train it properly, but the exact number should be tested, not guessed.
- Rehearse transitions. Mount, dismount, helmet, shoes, and nutrition setup should be automatic by race week.
- Keep the run honest. The marathon is usually the place to hold back, not to prove fitness too early.
The swimming piece matters more than many runners think, because a calm, efficient first hour keeps the rest of the day under control. In practical terms, that often means better body position, better breathing, and better confidence in open water, not just more laps in the pool.
The target I would actually set for race day
If I were setting a goal today, I would choose a course-specific target instead of chasing a single universal benchmark. A flat race in cooler weather can reward a much faster time than a hilly, humid, or windy course, so the same athlete can look “average” in one place and very strong in another.
The smarter plan is to build three targets: an A-goal that is ambitious but realistic, a B-goal that still feels like a win, and a C-goal that protects the finish if the day turns ugly. That is how I would approach it for most age-group athletes, especially if the swim is solid but the bike and marathon still need durability.
In other words, the best benchmark is not the number on a stats page. It is the time you can hold while staying calm in the water, disciplined on the bike, and honest in the final 10K. That is the version of the race that usually produces a finish you can trust, not just survive.